
Here’s the Performance Management Chart (PMC) for my 2006 season:
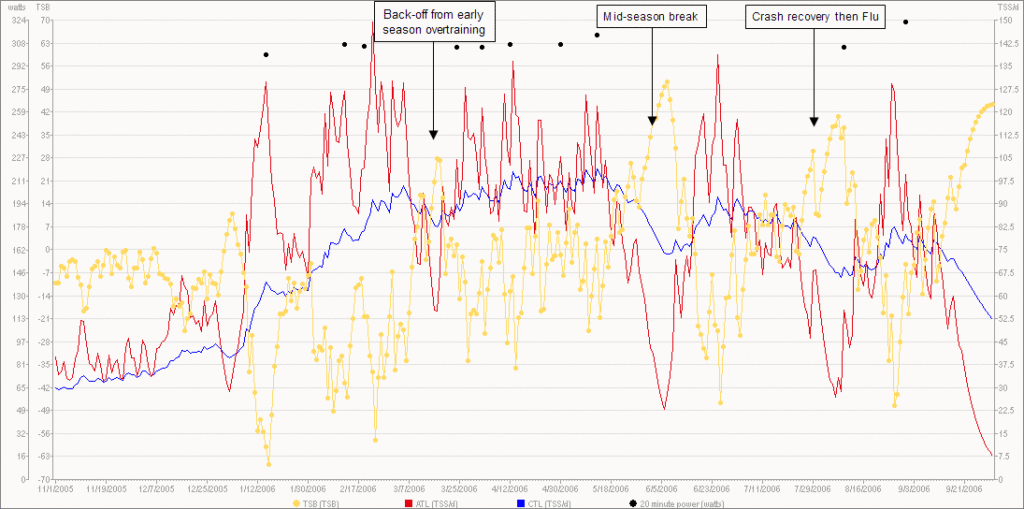
If it looks a little different than the default PMC in CyclingPeaks, that’s because I made a few usability enhancements:
- I changed ATL to be red instead of pink (OK, maybe it’s not so usability-related, but I rather not use pink if I still have primary colors I can choose from)
- I set all lines to be 1-pixel thick to improve the data-ink ratio, and
- I added data markers for Training Stress Balance (TSB) so it’s easier to see where the “points” are.
This last change is important because the only way to see a data point’s value is to rest the mouse pointer over one. Without the yellow circles, finding the daily TSB values is trial-and-error.
You may first notice how fast I ramped up my Chronic Training Load (CTL) early in the year. This is misleading as I was doing quite a bit of cross-training at that time and without a good way to estimate Training Stress Score (TSS) for those workouts, I simply didn’t enter them into CyclingPeaks. So while it looks like I ramped up too quickly, it was really just a transition from non-cycling workouts (running, swimming, etc.) to only cycling. I’d estimate my initial CTL was probably around 40-45 if I included all the cross-training.
The other thing an astute user of the PMC will notice is that my 10 best 20-minute power scores don’t really correlate with TSB. This is due to two reasons: 1) I didn’t race with a power-meter all of the time and, 2) I didn’t do too many threshold intervals once I started racing regularly. Next year I hope to get a PowerTap SL built-up on a lightweight rim, in which case I’d be more inclined to use it for all races.
Looking at the overall year, I was happy that I was able to maintain a CTL of around 95 for the first half of the summer. I did feel overtrained after Valley of the Sun, but I took a quick break and then continued to ramp up my CTL. Since 2005 was one of my lowest volume years, I realize that 95 was probably way too high, which probably led to a slight, chronic overtraining effect. I never really bombed or got super-fatigued, but then again, I never really increased my performance above what I had in previous years. Basically a season of mediocre performances.
The second dip in CTL in early June was when I took about a week and a half break. I wasn’t completely off the bike, but it was close. This was a planned break and I came out of it feeling refreshed, allowing me to ride aggressively at the Eagle Criterium. But I flollowed that with two 800+ TSS weeks — 837 and 967 to be precise. I think those two weeks brought me back into that slightly overtrained state which resulted in lackluster performances at Gate City Grind and Superweek.
I tried to rest after that and started to feel better by the Boise Twilight, but my crash in that race was the hardest I’ve ever gone down and even though I still finished the race, it took a good 3 weeks for my body to get the majority of healing done. In that time I also got hit with influenza. So by August, I was still feeling overtrained and didn’t have much left of the season. I tried to ramp back up for Parker, but there I just ended up suffering due to the wind, the altitude, and my allergies.
Here’s a chart I created in Excel:
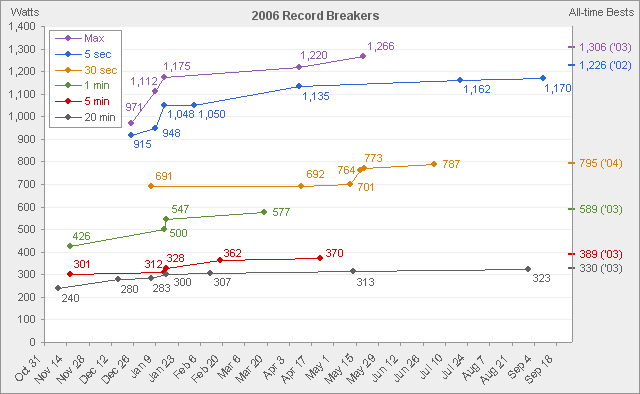
It shows all the times I broke a critical power (CP) — or Mean Maximal Power (MMP) in CyclingPeaks terminology — during the season. For lack of a better term, I’m calling it the Record Breaker chart. Down the right axis I added my bests from prior years. I had to do some creative Excel finagling to get the data arranged so the graph would do what I wanted. But in the end I think it turned out well. This is one of the benefits of having all my data in Excel — I can use Excel’s flexibility to create any graph I could ever want!
The main thing you’ll notice is that even though I slowly improved these CPs over the course of the season, I never broke any of my all-time bests. So my fitness did progress, but at such a slow rate that it never surpassed prior years. Confirming my prior conclusion that I was slightly over-trained, all season long. Another thing you may conclude is that 2003 was my best season. But I would say it was 2004. I track a number of other CP durations that I didn’t include in this chart. For example my 12 sec, 3 min, 6 min, 12 min and 30 min all-time best CPs were achieved in 2004. I had better results in 2004 as well.
So now it’s time to plan for next season which I just started doing. I’ll write more on that topic later, but for now, it’s time to enjoy the off-season!